Pete's Solar Energy Experiemnt
Last Date Revised: October 19, 2023
Home
Gas Producer Experiments
My Shop
Contact Us
December 3, 2015, quick update:
Harbor Freight still sells this kit. When it is on sale, it can be bought for as little as $139.95
Contents of this page:
1. Initial Observations
2. Setup and Home-Grown Circuitry
3. Data Recording
4. Representative Data Graphs
5. Conclusions (The experiment continues, anyway)
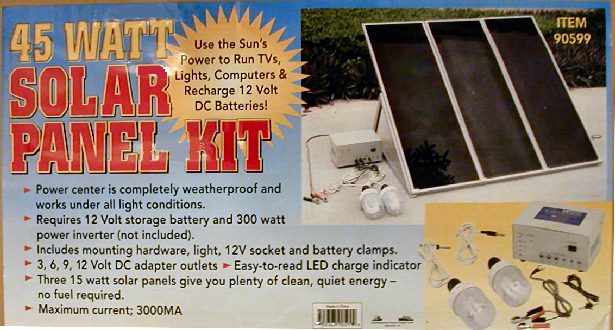
Harbor Freight 45 Watt Solar Panel Kit
In November of 2007, I bought this kit and installed it on our south-facing
deck so it gets sun all day, if there is any. I don't have any firm plans for using this setup to produce useful power.
It is purely an experiment to help me understand how much solar photovoltaic energy can be obtained at this exact spot
in the world, Lat. 44.874 dN, Lon. 92.294 dW.
For me, reading is good, but DOING is better.
I have a daily log of this experiment on an Excel spreadsheet and a rather lengthy text of internet dialogue somewhere
around here. I won't bore you with it for now. What follows is a summary of what my testing setup is and what it does.
The "Answers", so far:
My first conclusion about all this: I suggest that we can expect about 1/3 of the rated power of this 45 watt solar collector
for about 6 hours per day, at this place in the winter,or, about 100 watt-hours stored per day, if we have a pretty good
(non MPPT)PV charge controller, on a sunny day.
My second conclusion: On a cloudy winter day, we can expect to store about 3 watts of solar energy for about 6 hours
or about 18 Watt-Hours per day.
Observation 3: It appears that the solar collector peaks out for about 3 hours in the mid afternoon. Maybe I'd only need
to adjust the collector tracking about once every 3 hours to get all I can. The same goes for seasonal adjustments.
I changed the tilt by 7 degrees from optimal and saw NO difference in insolation. Maybe 3 or 4 tilt changes per
year are enough.
Observation 4: (A refinement of Obs. 3), When the solar panel is within about 25 degrees of "optimum",
there's no appreciable difference in output.
Observation 5: When the Harbor Frieght charge controller can deliver no current to the load, which happens for a
while in the morning after the sun comes up, and for a while in the evening before the sun actually sets and the sky
becomes totally dark, there IS NO CURRENT TO BE HAD, even if a sophisticated MPPT controller were to be used.
Current Situation
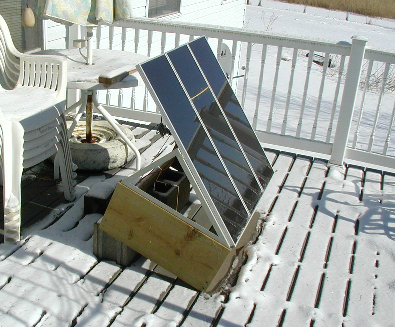
Here's my setup (as of March 16, 2008). The only things missing from these picture is the car battery, which is in
the basement, and a box holding some big rheostats that I now use to test the "MPPT" idea.
I didn't say it was going to be pretty!
Solar Panels: I can change the tilt by adding or subtracting 2 X 4's and 4 X 4's from under the back
edge of the support. The panels are tied down to the concrete blocks with a piece of baler twine so they won't blow over.
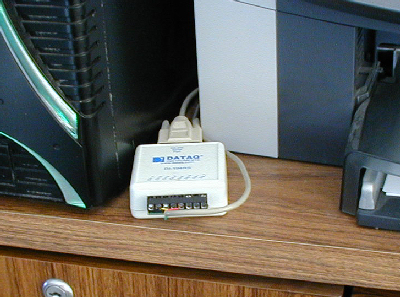
Data Acquisition Unit: This DAU has 4 analog channels and 2 digital channels. This model hooks up to a serial
interface, but now they have a USB model, which I'd recommend, instead. It is connected to the controller interface with a piece
of 4 conductor phone wire.
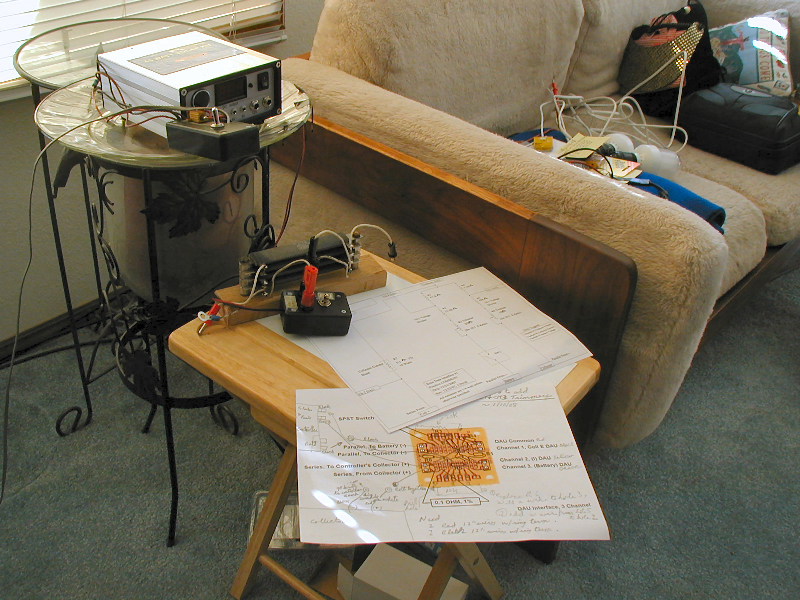
Controller, Controller Interface and Load Bank: Again, I didn't say it was going to look pretty! This is about
the fourth iteration. Maybe the twentieth?
This controller is the third one I have had. I don't think they can stand the stress of removing the collector input while the sun
is out. This controller is a later model than the one in the picture at the top of the page. This is a pretty nice controller, but
it is NOT a "MPPT" (Maximum Power Point Tracking) controller. The most notable difference between this model and the
original is that this one has a digital volt meter on the front. It is connected directly to the battery terminals.
Internally, the positive side of everything is common, not the negative side. That's why I had to build my interface with the
voltages going negative and the current going positive.
The controller interface board is contained within the little black box in front of the controller. On the top you can see a
switch that disconnects the the battery from the DAU, and, if you look closely, just behind the switch, you can see the 0.1
Ohm 1% power resistor that is in series with the collector panel to measure current flow.
In front of the controller on the little table sits the Load Bank. It consists of 4 16 Ohm 75 Watt wirewound resistors that can be
connected to the little black box in front of them in almost any configuration your little heart desires, from 4 Ohms to 64 Ohms.
The switch on that black box allows me to turn the load on and off without having to pull plugs out of the box. I almost always use
8 Ohms, for now. This gives the setup a power dissipation of about 21 Watts at "normal" panel output voltage when
current is flowing.
Finally, just to bug serious-minded folks, are the electrical schematic and the little interface PCB layout, almost readable.
Maximum Power Point Tracking Tests:
I don't intend to add an MPPT controller to this little system, but I do want to know how much more power I could be getting if I had
one. So, I will change my setup so I can switch my charge controller in and out and replace it with some power rheostats. Then I can
sit in front of the computer as it monitors panel voltage and current, changing the load resistance to see where the maximum power
point is for any particular solar drive voltage compared to a similar power (wattage)output using the HF controller.
As of March 15, 2008, I have stuck 4 rheostats in a box and added them to the overall system. They are:
25 Ohms,
100 Ohms and
250 Ohms, all on a common frame, and
35 Ohms all by itself.
The reason for this combination is that
1.)I know from developing the "load bank" mentioned above what the approximate range should be, and,
2.)Those were some rheostats that were available at a surplus electronics place on the web.
This box is hooked in parallel with the panel input and controlled with an SPST switch.
To use it, I simply turn off the switch on the front panel of the HF charge controller and turn on the switch to the rheostat box.
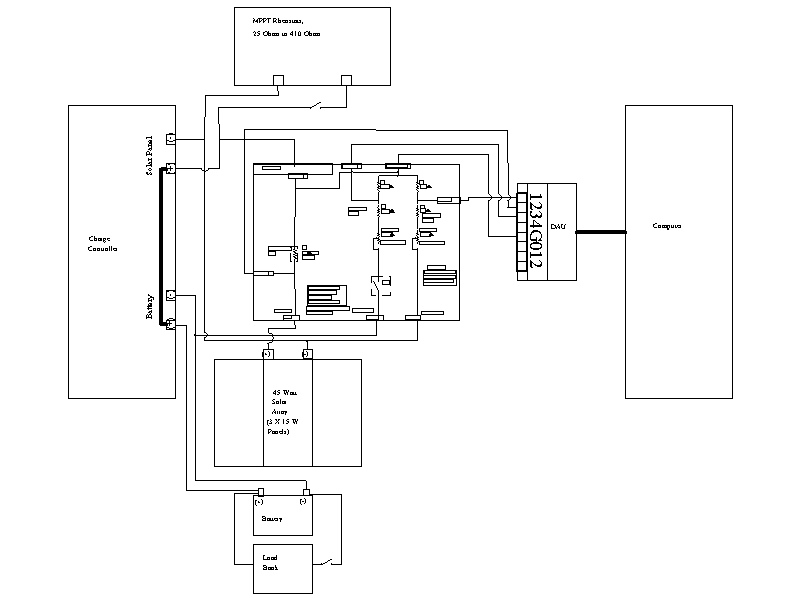
This next image shows the overall wiring of the system at present. The image after that shows the voltage divider PCboard that goes
between the charge controller and the DAU (because I couldn't get my CAD program, Turbocad Pro, V7,to save with enough resolution).
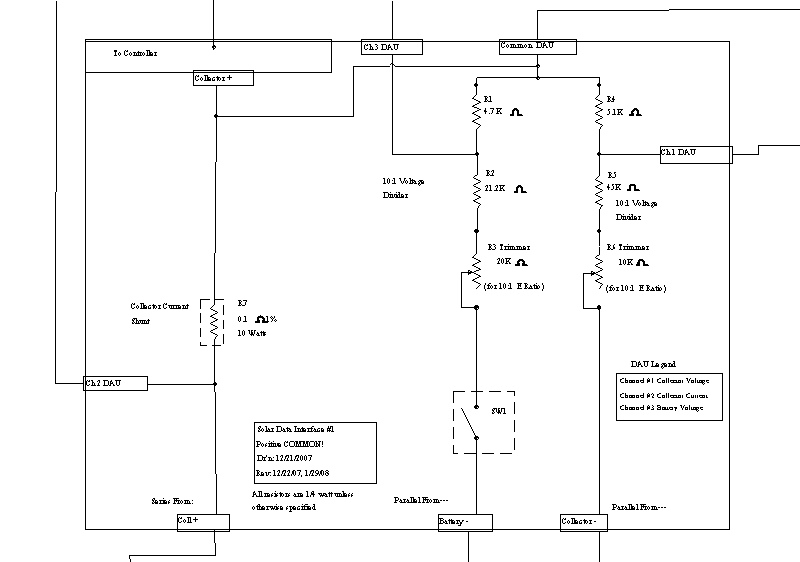
Schematic of Interface PC Board Between Controller and DAU
What's Happening Now:
The Harbor Frieght panels are hooked up and operating. I'm on the third charge controller now and it has a slight problem in
that the controller locks the panel to the battery whenever the panel voltage DROPS to the battery voltage. The only problem
for me is that I don't get to see the panel voltage drop as the sun goes down unless I turn the controller off, allow the
panels to go to open ckt voltage, and then turn the controller on again.
I record 3 channels of information each day with the DAU (Data Acquistion Unit) hooked between my PC and the solar PV
(PhotoVoltaic) system. The software that came with my $25 Dataq DAU allows me to graph the data that I store, albeit in a
limited manner. I can port the data to Excel where I can rework it but, I just haven't gotten "aroundtoit" yet.
The DAU requires signals between zero volts and 10 volts. The inputs are not isolated from eachother. So, I had to design an
interface between the solar system and the DAU. It is currently a passive voltage division and series current sensing system.
To keep "wasted" current to a minimum, the current sensing channel is running on a voltage so low that the DAU is
non linear in that region, but never worse than within 15% or so. That design is good enough for now.
Lastly, in defense of DATAQ, I bought this DAU as an entry level device in 2003 and never even took it out of the box. For
the $25 it cost me, it is a great tool. They still have it, in the "serial" verson for about $25 and in the USB
version for $50. REAL ones start at about $200, and they include better software.
Data Recording
Just today, I put a few images of of my recorded data here. The graphs, a set of 3 traces for each of
the 6 days presented, are from some of the sunnier days in January of 2008:
Here are some particulars of each "Set of 3 Traces":
Upper Trace: Photovoltaic Panel voltage output, negative-going. Multiply the value by 10 to get DC volts.
eg: "1.36" = 13.6 volts.
Middle Trace: Actual current being drawn from the collector panel. This is a positive-going signal. Multply the graph
reading by 8.5 to get actual current in DC amperes. (Think "10" to make it easier)
Lower Trace: Battery voltage, negative-going. Multiply the value by 10 to get DC volts.
-----------------------
You can generally see that the collector panel voltage rises as the sun comes up, but no appreciable current is generated
until the sun gets well up into the sky (if it's not a cloudy day). Later, the current falls to zero, but the collector
is still forward biased, producing the voltage you see for a couple of hours.
Then, of course, clouds during the day cause to current to fluctuate. The Charge Controller has a feature which shuts
off charging when it thinks the battery is full. You see that function when the current drops suddenly to zero and the
collector panel voltage climbs to it's full "no-load" open curcuit value (as high as about 23 volts DC, if
the scale was set that high).
Graphs
Here are 6 graph sets, if you are interested. Don't feel bad if they don't make full sense to you. The DAU
I am using is somewhat simple-minded as is it's software. (IT WAS cheap!) I had to do some work-arounds to get it to do some
of the things I wanted.
Again, here's how the graphs work: At the left of the charts you see the channel numbers, (1=1, 2=2 and 3=3). Just to
the right of each channel number is the chart's title. Above and below that are the limits for that channel graph.
"1=1" is the Collector Voltage graph. The limits on the chart, .000 and -2.000, mean that the voltage is zero
at the top of the chart and -20 volts at the bottom of the 1=1 trace area. The "X10C" simply means that you multiply
the reading by 10 to get the actual Collector voltage. (The number .013 just above "X10C" is the reading that was
at the black vertical bar that's about 4 squares in from the left.)
"2=2" is the Collector Current graph. The limits on the chart, .000 and .500 mean that no current is flowing
from the collector panel at .000 and, at .500 you'd multiply by about 8.5 to get the actual current in amperes. Sorry about
this, but that's the non-linearity of the DAU that I mentioned earlier. The "X10A" implies "multiply by
10" and that's good enough for you to get a general idea of what's actually going on. I use an amperage correction
table that keeps my "actuals" to about 2%.
"3=3" is the Battery Voltage graph. Same everything as "1=1".
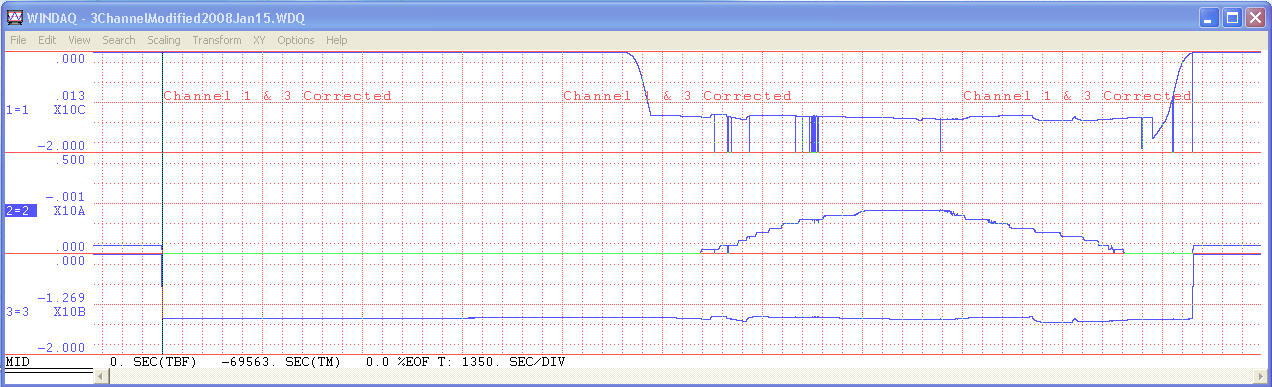
January 15th, 2008:
A totally sunny day. The voltage comes up as soon as the sun does, and about an hour later current starts to flow. The current
gets up to about 1 1/2 amps, (middle chart) then slowly starts to decay about an hour and a half before the sun is gone. I
say "sun is gone" because the voltage doesn't get back to zero until almost ALL the light in the sky is gone.
What you can't see here is that, during the day, I am usually (not always) adding a load to the battery to keep the controller
from going into "overcharge" mode. If I let it do that, I'd not see how much current I could have generated. That,
of course, is the whole reason for this experiment!
You see a few vertical bars on the upper voltage chart going all the way to the bottom of that graph image. That's the voltage
going to "open circuit" when the controller shuts off because it thinks the battery is "full".
The lower chart shows that how the battery (a new car battery,not a deep cycle battery, which is what I should have) responds
to the changes in solar input.
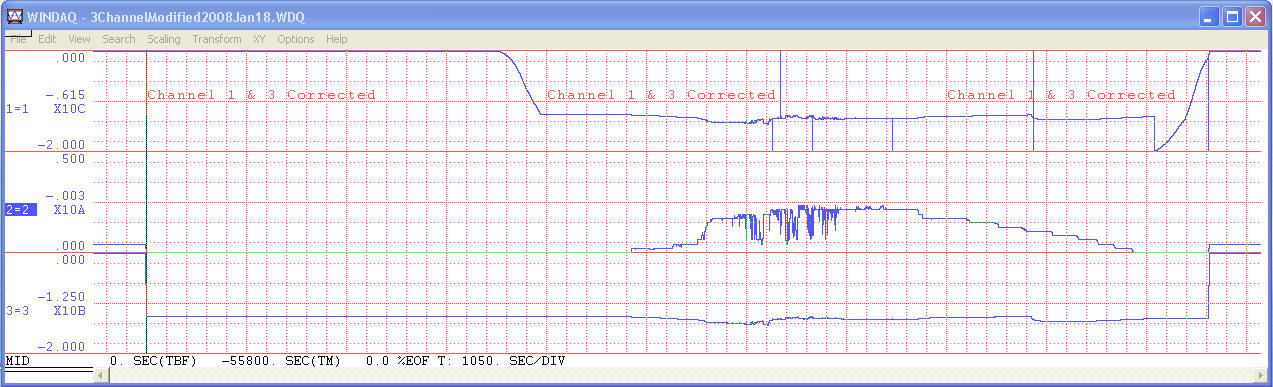
January18, 2008
This day started out cloudy, so the current started to rise more slowly than the day before. a sharp rise in current as the
clouds all but disappeared, then some puffy clouds came by for a few hours. By mid day the sky had cleared.
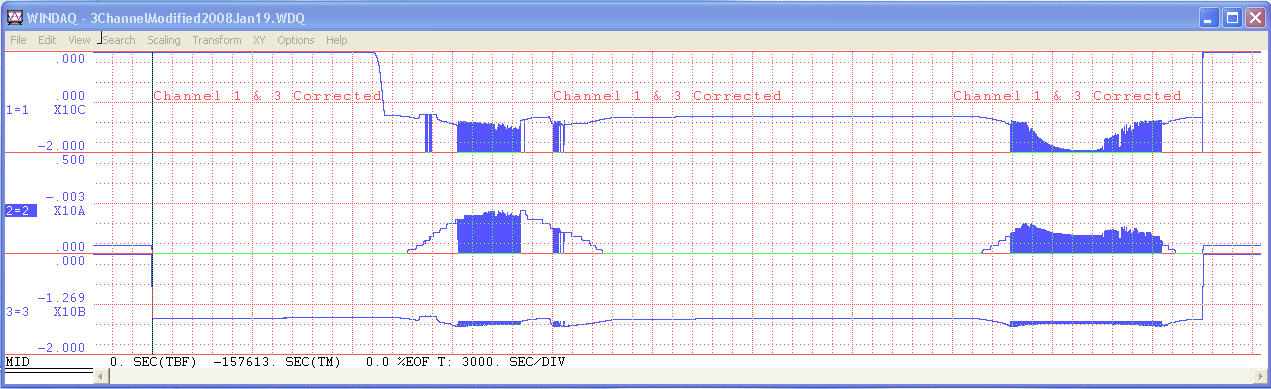
January 19th and 20th, 2008
Here, I let the system run on its own for 2 full days,with a fully charged battery. The first day was fully sunny and the
second day was evenly "slightly hazy". You can see that all the vertical bars on the 1=1 chart run together as
the controller goes into overcharge mode, waits a while, tries to charge the battery again, shuts off. etc.. On the lower
trace, the battery's voltage, you can see how it's voltage responds as the controller turns on and off.
This Data Acquistion system is set to take a sample of each channel every 20 seconds, so there are many more samples than
you can see on these compressed graphs, which usually (except for this one) cover about 24 hours.
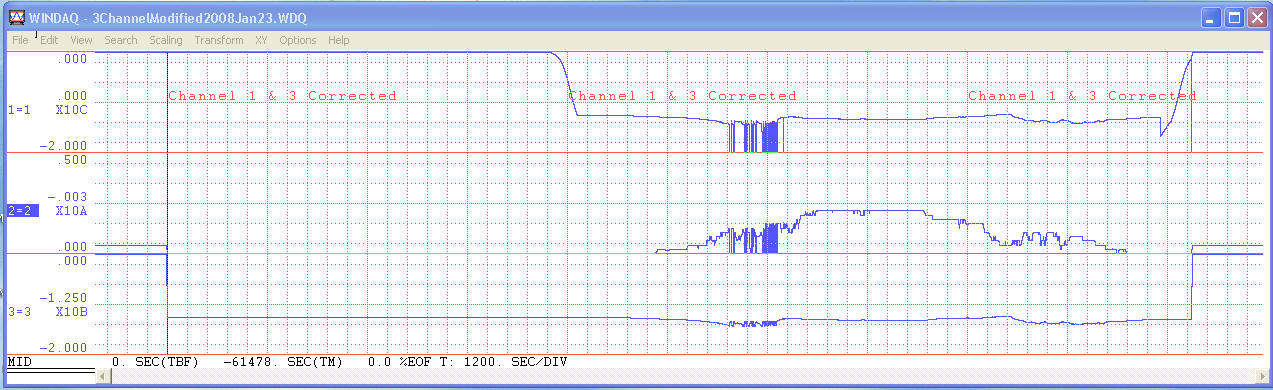
January 23, 2008
Pretty sunny start to the day, then a few clouds, then full sun. "Overcharge" started at mid morning, so there's where
I added some load. My load, these days is usually an 8 ohm 50 watt wire wound resistor. Anyway, then it was sunny for the rest
of the day. At mid afternoon, I disconnected the load to allow the battery to recharge before dark.
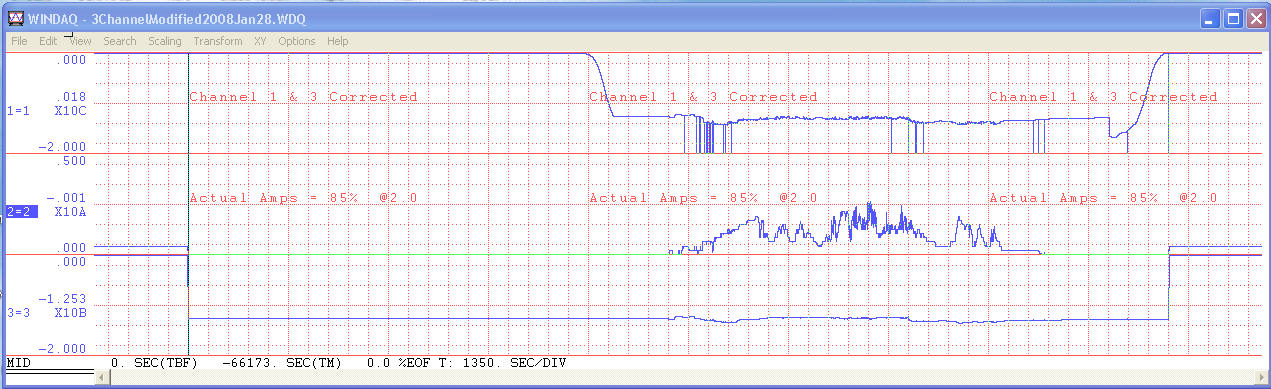
January 28, 2008
Here's an example of a day that is basically sunny, with continually passing clouds. Kinda neat!
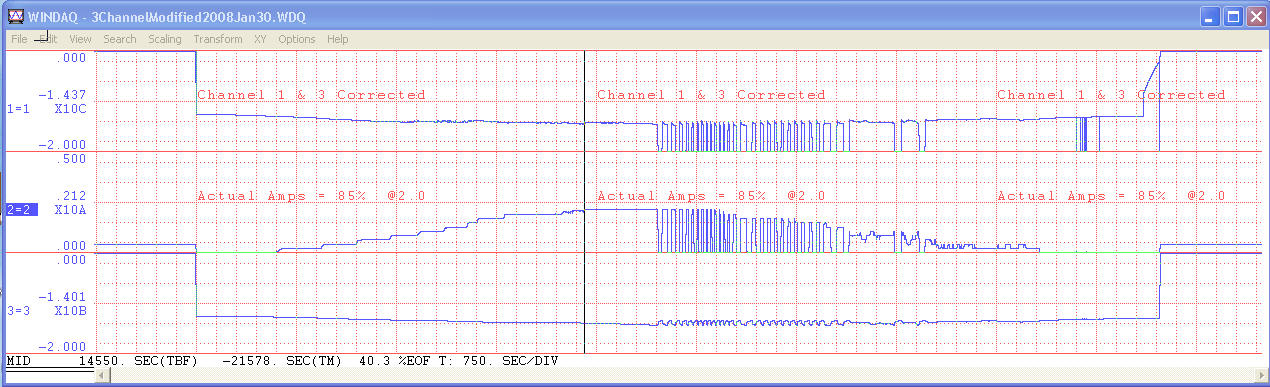
January 30, 2008
I have usually started each day's graph just before I went to bed the previous night. That's why there is a long period of
"dead time" before the sun comes up. But for this one, I started taking data AFTER sunrise.
Here, we started the day with a somewhat discharged battery. So, the battery took all the current the panels could deliver
until about noon, then the controller started into overcharge mode. The nice thing about this graph is that you can clearly
see the action on all 3 channels.
To "MPPT" or not to "MPPT"?, That is the question----:
As of this date, March 16, 2008, I have taken enough MPPT data to convince me that there is very little (less than 5%) to
be gained from having an MPPT controller on this particular solar panel. As I see it so far, the sharp "over voltage" output
curves that we see on the web for expensive panels does not occur with these.
December, 2008
Now that I have a whole year of data, I conclude that, if you are already connected to the grid, then solar photovoltaic energy
collection and storage is not for you. Maybe, if and when the price of the equipment drops by a factor of about 4 and/or the cost
of your electricity doubles, take another look.
Feel free to email me if you have any questions.