JXQ-10 Sep 2013 Run Results
Created: April 9, 2014 (Long after the fact)
Revised: October 23, 2023

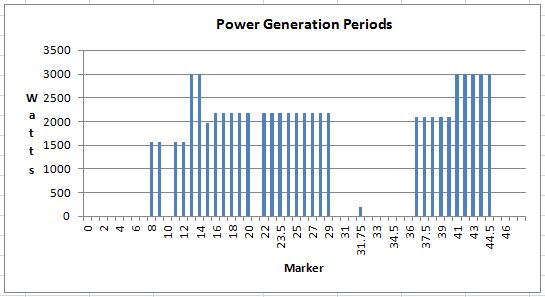
This test starts at marker "0", at 11:56 AM.
Marker "7" is at 12:27 PM and Marker "44.5" is at 4:31 PM. From this, I hope you can see the periods
during which we we able to produce power with the system
configured as I describe it below.
French Creek Valley Home
Back to Our JXQ-10A Main Page
Contact Us
Summary
On September 10, 2013,
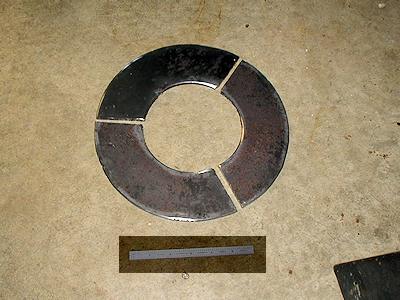
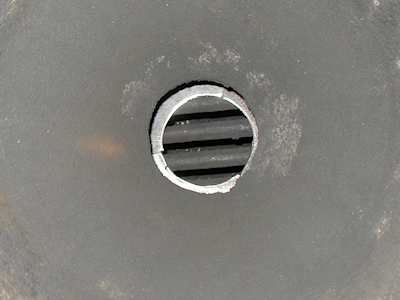
I finally got to try out my "new" 5 inch diameter grate restrictor:


It really didn't make any difference in the temperatures
that I record.
I am now using 6 inch long thermocouples, so I should be pretty much in the right place to measure from.
In fact, reducing the effective size of the grate from about 11 inches diameter to about 5 inches diameter
didn't have any effect at all on the outcome as far as I can tell.
I did, however, run for 2 hrs 10 min w/2160 watt load, clean the grate (from below)
and remove about half of the partially burnt fuel from the hopper. I also replaced
the fiberglass that I use in the filter compartment.
Then, with a few fits and restarts, got things going again at various load levels. Finally, I was able to run at 3660 watts for 35 minutes. That is
about 3 times as long as I have ever been able to draw that much power in the past.
THE MAIN problem now seems to be fuel burning upwards to the top of the hopper.
I have spent a lot of time trying to figure out how to report all this. Just recently I compiled a 26 minute youtube video that attempts to summarize the
whole event. It's at:
September 10, 2014 JXQ-10 Run Summary
It now seems pretty clear that THE problem is that of the fuel burning Upwards in the hopper during the run.
AND, packing the fuel firmly IS the way to go. I want MORE pressure drop across the fuel bed, not less.
During the last part of the run, where I was running at 3660 watts, I could watch (and hear) the generator Hz start to decline.
As soon as that decline started, I would refill the hopper, right to the top with wood chips and tamp it down.
Then I could see and hear the generator speed pick back up. I repeated this cycle several times with that same results,
until the fuel was burning all the way to the top again. At that point, I knew that I wouldn't be able to control the gas any more, so I stopped the run.
This was a good day for me.
In addtion, I recently met a guy, George Adams, who lives about 50 miles away who has built a "Victoria" gasifier.
He brought his system down here and we ran both of them on and off during the day.
By the way, George is the guy I partnered with on the first grain-cleaner-turned-wood-chip-sorter:
Wood Chip Sorting machine
And, as you may or may not know, I bought another one for myself:
My Second Wood Chip Sorting Machine
Details
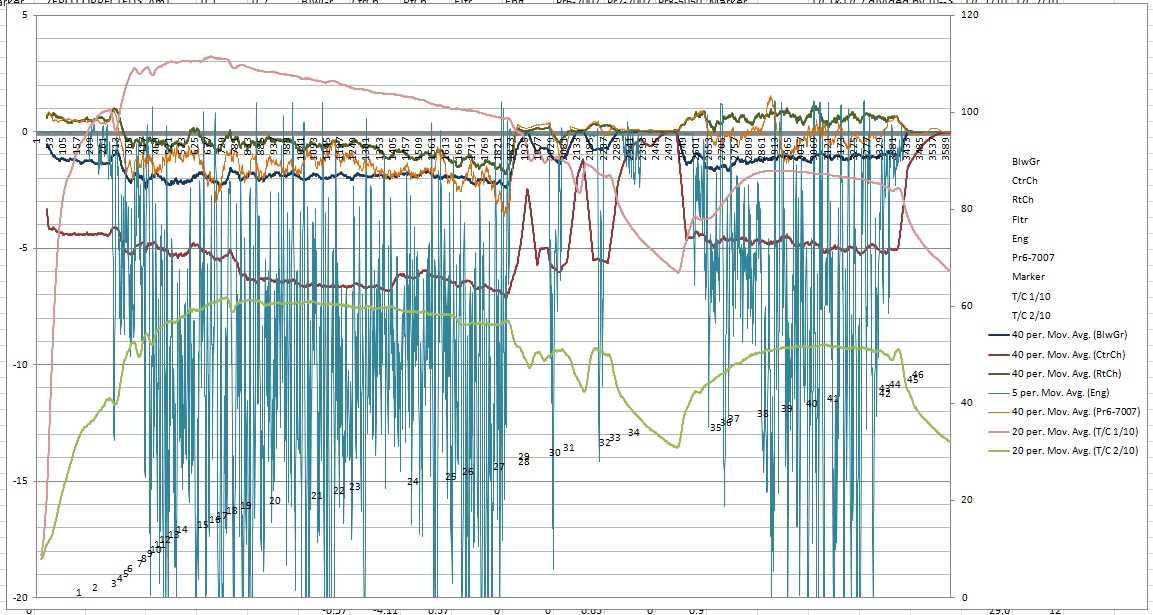
I have attached a rather busy graph of the data that I took on my arduino-based datalogger during the Sep 10, 2013 test.
I don't expect others to be able to make much of it, but it shows how much information I can get with this datalogger.

The colors on the graphs aren't all that easy for me to differentiate, so it takes some concentration to make sense of what is going on.
I can "fatten up" the lines and the legend dashes, but there's a limit to how much of that I can do without creating other problems.
I only use this complex view to get a bird's eye view of the action. When I attempt to home in on an issue,
I make simpler graphs that plot only one, two or three variables.
For example: By plotting only the "engine" (lite blue, at the woodgas carburetor tee) against PR6,(orange) which is the output of the cyclone separator,
I learned that the two pressures (suctions) are exactly 180 out of phase all the time!
This is hard to believe, since they take readings on both ends of a pipe that is only about 6 feet long.
I am pretty sure this means I have some sort of a pressure wave going.
In normal operation of the JXQ-10,
that is, supplying the two burner stove, there are pressure pulses at about a one pulse per 2 second interval.
These pulses bounce the water up and down in the center and right hand chambers. As the suction in the center chamber increases,
the height of the water column in that chamber increases changing the natural pulse frequency to some degree.
This would occur at some constant rate once it stabilized. When the user turns one burner up or down or turns on or off the second burner,
everything changes. If both burners are turned off. The blower sucks hard enough on the center chamber and blows hard enough on the right chamber
to push the gas from the right chamber (the output chamber) back into the center chamber. The net effect of this action is to reduce
the suction on the grate to zero, so no more gas is produced. That system IS the regulator.
Once I add an engine that SUCKs on the output, instead of the output always being at a positive pressure, everything changes.
I could go on and on with guesses and (possibly) flawed observations----.
However, what we DO know is that we are getting 30 Hz pulses of suction from the two cylinder engine as it runs at 1800 rpms.
The magnitude of these pulses varies with engine load. The magnitude also varies with gas quality as the engine governor tries to suck in
more fuel if gas quality starts to drop. All these things are going to effect the complexity of what those pulses do to the rest of the system.
The one-half Hz positive-going filter pulses beat against the 30 Hz negative-going pulses from the engine. And predicting the resulting harmonics
is darn hard since magnitude conditions and even net volume of the chambers changes all the time.
You can see that my 5 second per sample rate is 'way too slow to catch the wave envelope of the primary pulses, let alone the harmonics.
I'd probably have to sample at about 300Hz to start to see all that happen. Whether I will do that or not, is yet decided.
As I think I have said earlier, the stock filtering system is NOT designed to handle an engine. But, since I do use it to cool and filter the gas,
I must be sure that I run it in a mode that NEVER uncovers the hot gas inlet to the center chamber.
I already mentioned one of the main "learnings" from this test, but I still have to solve for keeping the temperatures up as long as I want to and
to keep the right chamber from ever going positive while the engine is running.
Next test will be to run about the same way, but with the differential pressure sensor installed across the fiberglass filter box.
But!!!: If you watched the Yahoo woodgas group (before ir collapsed), you no doubt heard of "drizzling" wood chips into the hopper to keep
the depth of burning under control.
That will be central to changes to our next runs in the spring of 2014.


